
| |
||||||||
|
||||||||
Instructions
What is MetalionRNA?
MetalionRNA is a program for predicting binding sites of three different types of metal ions (Magnesium, Sodium and Potassium) in RNA structures.
For more details see:
Philips A, Milanowska K, Lach G, Boniecki M, Rother K, Bujnicki JM
MetalionRNA: computational predictor of metal-binding sites in RNA structures.
Bioinformatics 2011 Nov 21. [PDF]
Which potential to choose?
MetalionRNA is based on the statistical potential approach. One of the weaknesses of it is the relative paucity of RNA–ion complexes. Thus, once per week the MetalionRNA web server downloads structures of RNA–ion complexes newly released in the PDB and adds them to the original training set and the statistical potential is recalculated. The MetalionRNA website allows the user to select whether to perform predictions with the original potential or with the one that is being continually updated. Moreover, it is possible to use potential trained using 11152 magnesium sites refined by prof. Wladek Minor's group
What do I need to analyse and display the obtained predictions?
You need a molecular visualization system.
We recommend PyMol Viewer, which is an open-source and user-sponsored molecular visualization system. You can download it from https://www.pymol.org
What do I need to analyse and display the obtained predictions?
LigandRNA's output is the ranking of poses submited by the user (MOL file) in the form of txt file. The poses are ranked by their potential value. Just check which pose scores highest and display it using the same molecular viewer!
What do I need to make a prediction?
You need to have a PDB file containing an RNA or DNA structure.
Please take into account that the grid-based approach is designed for small and medium molecules, so the input file size is limited to 1MB. If your file is bigger, edit it and run your computations only over the most relevant part.
What do I need to analyse and display the obtained predictions?
You need a molecular visualization system.
We recommend PyMol Viewer, which is an OPEN-SOURCE and USER-SPONSORED molecular visualization system. You can download it from https://www.pymol.org
Tips and tricks
To display proposed binding sites:
-
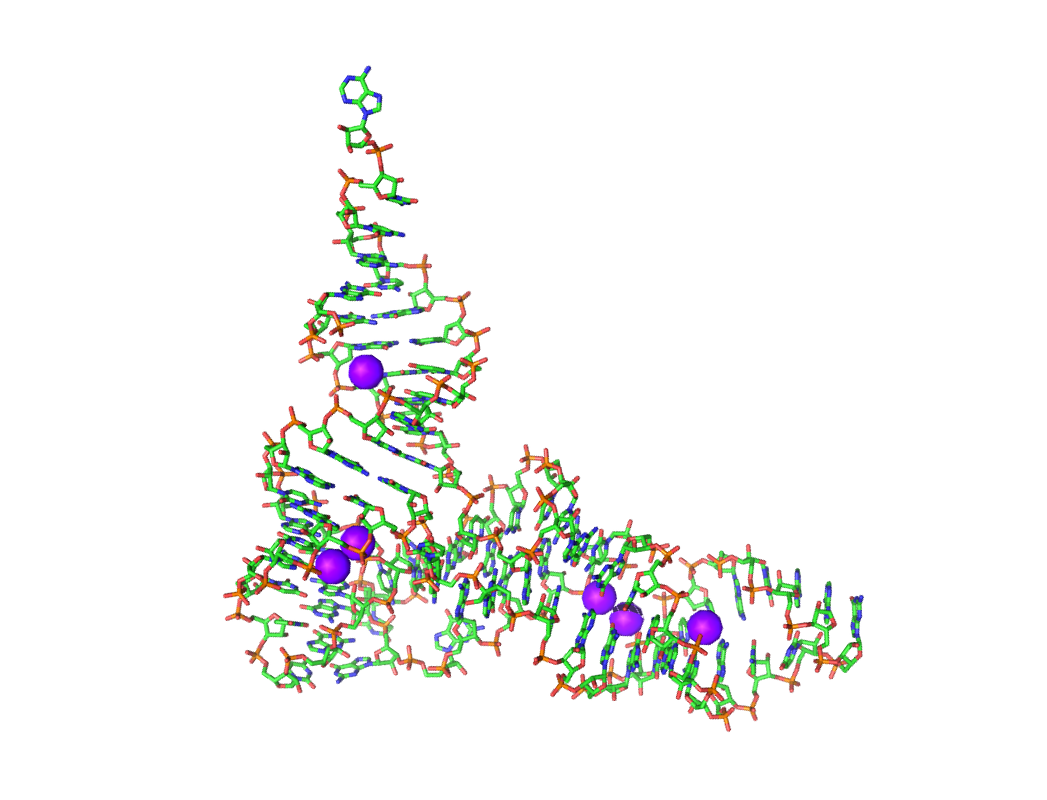
Open 1EHZ_Pot_Surface.pdb or 1EHZ.pdb in any molecular viewer.
Choose one of the following options.
- Open file 1EHZ_Hits.pdb.
- In PyMol command line: go to the dictionary where 1EHZ_Hits.py file is (use cd command) and type: run 1EHZ_Hits.py.
- In PyMol main window go to: File -> Run... and choose 1EHZ_Hits.py file.
- Predictions will be shown as purple spheres (see below). The predictions are ranked by their potential value.
- If you want to reduce the prediction number, open 1EHZ_Hits.py or 1EHZ_Hits.pdb in any text editor and remove as many SPHERE/ATOM lines as you wish. Please keep in mind that the predictions with the highest potential are at the top of the list. Display the hits again.
For a molecular viewer:
For PyMol users only:
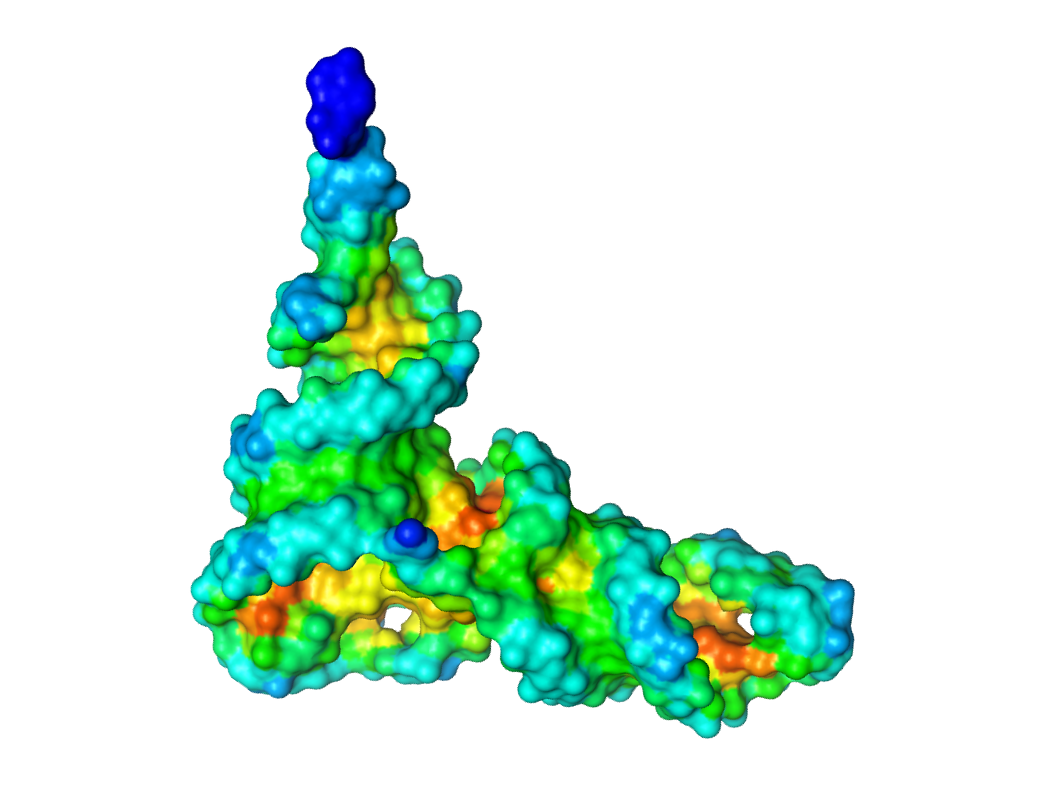
To display an electrostatic potential surface (in PyMol):
Open 1EHZ_Pot_Surface.pdb.
Display the opened structure as a surface (choose option: show: -> surface)
Color the surface with b-factor (choose option: color: -> spectrum -> b-factors)
The higher the potential is, the redder the colour is. Green and blue areas correspond to the low potential, while the red and orange colours correspond to high potential values.
To get MetalionRNA output files for some other RNA molecule please download the following files:
|
|

|